


"Graphs are a visual treat, as they can present complex information in a quick and easy manner. Mostly graphs are used to reveal a trend, compare statistics or they can be even used to establish relationship between two different variables."
Get Started for FREE
Sign up with Facebook Sign up with X
I don't have a Facebook or a X account


 Your new post is loading...
 Your new post is loading...
Your new post is loading...
"Graphs are a visual treat, as they can present complex information in a quick and easy manner. Mostly graphs are used to reveal a trend, compare statistics or they can be even used to establish relationship between two different variables." 
No comment yet.
Sign up to comment
|


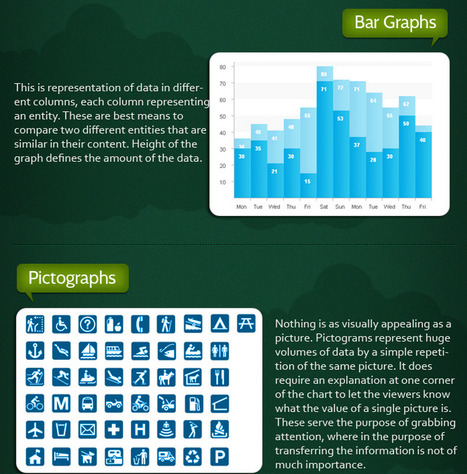
A great infographic that allows you to quickly compare a variety of graph types, as well as explanations about each type of graph.