
Effective visual representations can help higher education bridge silos and unleash the power of data.
Get Started for FREE
Sign up with Facebook Sign up with X
I don't have a Facebook or a X account


 Your new post is loading...
 Your new post is loading...
Your new post is loading...
Effective visual representations can help higher education bridge silos and unleash the power of data. 
No comment yet.
Sign up to comment
|

ghbrett's curator insight,
July 18, 2013 9:08 AM
This is another post where I recommend that you scroll down to have a look at Robin Good's great commentary. I can not beat his for details. His Scoop.it site is: http://curation.masternewmedia.org/ Thanks Robin! 
Jenifer Rettler's curator insight,
July 18, 2013 10:15 AM
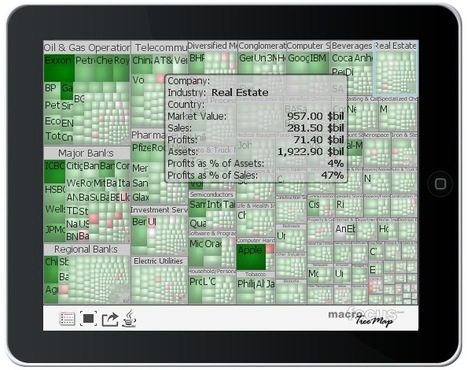
If you are looking for additional visualization tools for displaying data, TreeMap v. 3.0 offers a classic tree map layout as well as others, like squarified variant, circular, tag cloud and voronoi. |