Education 2.0 & 3.0
148.6K views | +0 today
Follow
Education 2.0 & 3.0
All about learning and technology
Curated by Yashy Tohsaku
Your new post is loading...
Rescooped by Yashy Tohsaku from Eclectic Technology
Scoop.it!

Words, Pictures, Numbers, WOW! – 2nd Grade Infographics Attract Attention

Words, Pictures, Numbers, WOW! – 2nd Grade Infographics Attract Attention | Education 2.0 & 3.0 | Scoop.it

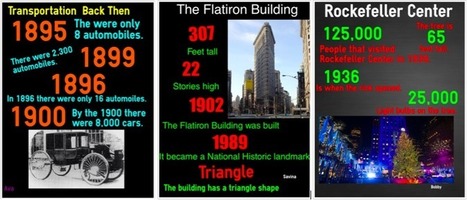
"For the past four years, we’ve been using infographics with our students at different grade levels. This year, our second graders were studying New York City to make comparisons between its historical past at the turn of the last century with today. Instead of the typical presentation poster, they made infographics using the Easelly app."


Via Beth Dichter
Beth Dichter's curator insight, January 25, 2015 6:58 PM

Can 2nd graders create infographics? Based on this post from ASIDE the answer would be yes! The students were able to Easel.ly and create 8 infographics that show their understanding of New York City at the turn of the century and today. Consider trying a similar project with students in your classroom (and make sure to learn to use Easel.ly before you introduce it to your students!).

Rescooped by Yashy Tohsaku from Eclectic Technology
Scoop.it!

Seeing Is Believing: Visual vs. Linear Content

Seeing Is Believing: Visual vs. Linear Content | Education 2.0 & 3.0 | Scoop.it

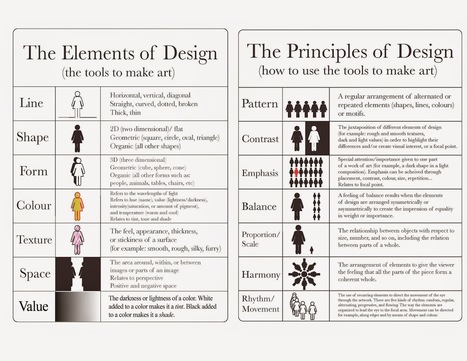
"In order for our learners to see how designing information changes how it is viewed, the students this year placed their visual infographics side-by-side with their linear notes to see the transformation. It was the “ah ha” moment, when they could examine how the delivery of content mattered and how the deliberate choices in font hierarchy, color selection, and placement changed the way others perceived the ideas."


Via Beth Dichter
Paul Macmullen's curator insight, October 21, 2014 6:32 PM

Useful reference for a graphically challenges creature of language such as myself :-)


WhoIsAbishag's curator insight, November 2, 2014 9:32 PM

NLP Strategies.

Ness Crouch's curator insight, July 2, 2015 10:20 PM

Visual and linear learning design should come together to create a learning tool. Infographics are an example of this.